

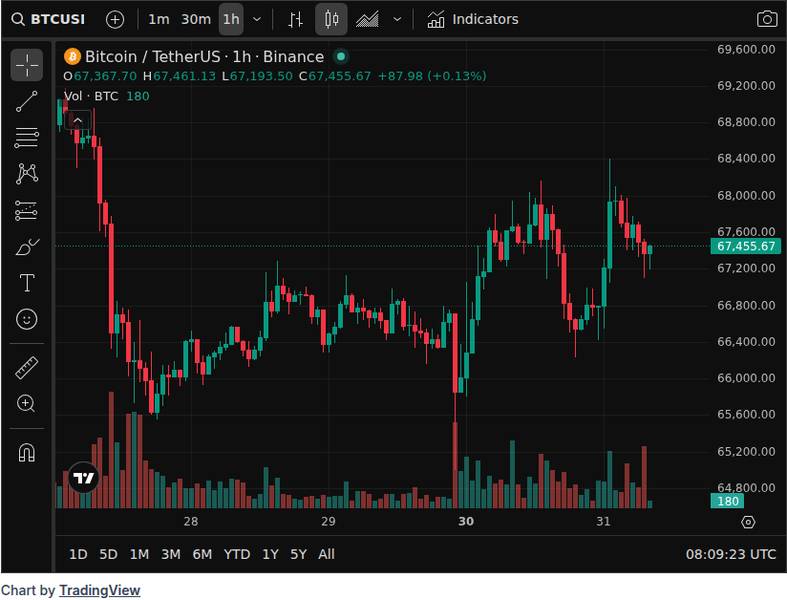
Bitcoin traded near $67,274 on March 31, 2026, while the Crypto Fear and Greed Index sat at 11, deep in Extreme Fear territory. For investors tracking Bitcoin today, that disconnect between a relatively stable price and deeply negative sentiment illustrates why monitoring one number is never enough.
A proper Bitcoin dashboard starts with more than a spot quote. It pairs price with volume, market capitalization, supply data, sentiment readings, and on-chain network conditions to give investors a fuller picture of what is actually happening.
Bitcoin’s core market metrics tell a fuller story than price alone
What to Know
- Spot price: Bitcoin traded at $67,274.42 on March 31, 2026.
- 24-hour liquidity: Trading volume reached $43.3 billion across tracked exchanges, with a market cap of $1.346 trillion.
- Supply context: 20,009,412 BTC are circulating out of a hard-coded maximum supply of 21,000,000 BTC.
Spot price without volume context can mislead. A $67,274 reading backed by $43.3 billion in 24-hour volume suggests active participation, not a thin-market anomaly. Market capitalization of $1.346 trillion anchors Bitcoin’s relative weight against other asset classes.
Circulating supply still matters because Bitcoin’s issuance schedule is fixed. With roughly 990,588 BTC left to be mined before the cap is reached, every halving cycle tightens new supply further. Investors who track Bitcoin today without factoring in supply dynamics miss a core piece of the valuation framework.
Bitcoin showed a 24-hour price change of roughly -0.5%, a mild dip that on its own could mean almost anything. The question is whether other layers of data confirm calm or signal hidden stress.
Sentiment data reveals whether the market is confirming the move
The Crypto Fear and Greed Index read 11 out of 100 on March 31, classified as Extreme Fear. That score sits well below the neutral 50 midpoint and indicates broad market anxiety despite Bitcoin holding above $67,000.
Sentiment is context, not a standalone trading signal. An Extreme Fear reading during a -0.5% daily move suggests that positioning and mood have drifted far more negative than the price action alone would imply. Traders watching recent price action across XRP, Shiba Inu, and Ethereum will recognize a broader pattern of cautious sentiment across the crypto market this week.
Social momentum data reinforced the picture. LunarCrush put Bitcoin’s galaxy score at 36.7 with an AltRank of 51, indicating soft engagement rather than any euphoric reaction to market conditions.
No discrete market-moving catalyst, such as a regulatory filing, major exchange event, or protocol upgrade, was verified behind the current sentiment drop. That absence makes sentiment and positioning context more important than headline interpretation. When fear is elevated without a clear trigger, the data often reflects accumulated uncertainty rather than a single shock.
This pattern echoes the broader environment around recent Bitcoin spot ETF outflows, where capital movement signals have diverged from relatively stable spot prices.
On-chain activity and fees show what the Bitcoin network is actually doing
Price and sentiment measure market participants. On-chain data measures the network itself, and the two do not always agree.
Blockchain.info recorded approximately 486,091 confirmed transactions in its latest daily snapshot. That figure reflects actual usage of the Bitcoin network for transfers, settlements, and inscriptions, independent of exchange-driven price moves.
The estimated hash rate stood near 844.66 EH/s, a measure of total computational power securing the network. A hash rate at that level indicates that miners continue to commit significant resources to block production, a signal of long-term network confidence even during an Extreme Fear sentiment reading.
Mempool.space recommended a fee of just 1 sat/vB for fastest, half-hour, and hour confirmation targets at the time of research. A uniform 1 sat/vB across all urgency tiers signals light near-term fee pressure, meaning the mempool is not congested and transactions are clearing without competition for block space.
For readers following developments across the broader blockchain ecosystem, network-level health checks like these offer a layer of context that pure market data cannot provide.
A daily checklist for tracking Bitcoin beyond the headline
Investors who want to track Bitcoin today with more depth than a price ticker can build a simple three-layer routine.
- Market layer: Check spot price alongside 24-hour volume and market cap. A price move on thin volume tells a different story than one backed by $43 billion in turnover.
- Sentiment layer: Review the Fear and Greed Index and social engagement scores. An Extreme Fear reading of 11 during flat price action flags a divergence worth monitoring.
- Network layer: Look at confirmed daily transactions, hash rate, and current fee estimates. When all three are stable, as they were on March 31, the network is functioning normally regardless of market mood.
Combining these three layers separates reactive price-watching from informed Bitcoin tracking. On March 31, the data showed a network operating smoothly at 844.66 EH/s and 486,091 daily transactions, a market with $43.3 billion in daily volume, and a sentiment gauge flashing Extreme Fear at 11. Each layer added context that the others could not provide alone.
Disclaimer: This article is for informational purposes only and does not constitute financial or investment advice. Cryptocurrency and digital asset markets carry significant risk. Always do your own research before making decisions.